|
|
 |
Introducing XRby Jim Furtado |
[ Webmaster's Note: The following article appears in The 1999 Big Bad Baseball Annual. ]
Introduction
I have the best kids on the planet. My wife is the prettiest, most intelligent woman in the world. Nolan Ryan is my favorite player of all time. Ken Griffey Jr. has the prettiest swing I've ever seen. The Red Sox are my favorite team. Extrapolated Runs (or XR) is the simplest, most accurate run estimation formula currently available. What do all those statements have in common? They are my, admittedly, biased opinions.
Although many people spend a great deal of time and energy trying to convince others of the absolute validity of their opinions, I won't do so here. What would be the point? These are my opinions. Just because they are true for me, doesn't necessarily make them true for you. My needs and desires are most likely much different than your needs and desires. Because of that we might come to different conclusions regarding these questions.
So what am I going to do here? Well, rest easy, I'm not going to drone on and on about my family; you're not interested in hearing about them anyway. I also won't get into a discussion about my favorite players or my favorite team; this isn't the place for such a discussion. What I will do is explain my Extrapolated Run system to you. I figure that although you might not agree with me about who has the best family, you might agree with me about what makes a run estimation system useful.
A little background
A couple of years ago, while searching for sabermetric links to add to my Internet web site, I stumbled upon Stephen Tomlinson's homepage. What caught my eye was an article Stephen wrote championing Paul Johnson's Estimated Runs Produced (ERP) formula. After reading Stephen's essay, I dug out my copy of The 1985 Bill James Baseball Abstract and re-read the original article about ERP.
I must admit when I first read the article back in 1986 it didn't make a lasting impression. Fortunately, that wasn't the case with my second look. In that pass, I noticed that besides Johnson's description of the method, the article also included a short comparison between ERP and RC.
James found that ERP was slightly more accurate on a team level than RC. He also found ERP didn't suffer from RC's problems with players with high OBA and high SLG. However, as interesting as those facts were it was another of James' comments that spurred me into to action. James said, "The excitement of finding Johnson's method is 1) it is so simple, and 2) it was developed entirely independently. These two things suggest that there probably are compromises between the two methods that will prove to be yet more accurate than either method."
His thoughts greatly excited me. You see, I had made my own discovery while reading Johnson's essay. If you take a look at the formula, I'll show you what I discovered.
Although the original equation
ERP=(2 x (TB + BB + HP) + H + SB - (.605 x (AB + CS + GIDP - H))) x .16
looks a lot more complicated than it needs to, if you take the time to break it down, it is essentially a linear weighted formula
ERP=(.48 x 1B) + (.8 x 2B) + (1.12 x 3B) + (1.44 x HR) + ((HP+BB) x .32) + (.16 x SB)-(.0968 x (AB + CS + GIDP - H))
A linear weighted formula, which, as opposed to Palmer's Batting Runs,
BR=(.47 x 1B) + (.78 x 2B) + (1.09 x 3B) + (1.40 x HR) + (.33 x (BB+HB) + (.30 x SB) - (.60 x CS) - (?? x (AB-H)) - (.50 x (OOB))
uses a fixed value for an out.

This discovery was very fascinating for a couple of reasons. First, if you compare Johnson's values with Palmer's weights you can see that they came up with very similar values. The fact that they derived these values using different methodologies gives the values greater validity. Second, the fact that Bill James criticized Palmer's work in his 1985 Historical Abstract while lauding Johnson's work in his 1985 Baseball Abstract didn't make sense.
So what could this fledgling sabermetrician do? The only logical thing––I had to study the matter myself.
How was XR developed?
Could the linear formulas hold their own against RC in a larger study?
Before delving deeper into the matter, I had to determine if linear formulas could hold their own vs. RC in a larger study. To do that, I constructed an Excel spreadsheet and compared BR, RC, ERP and all the other formulas I knew about.
Of course, that wasn't quite as easy as you'd think. First, I had to assemble team statistics for every club for the 1955-1997 period. This task, in itself, was difficult. Nevertheless, with the assistance of Sean Lahman and Tom Ruane, it was not an insurmountable problem.
I next had to make a decision about exactly how I would determine accuracy. As Brock Hanke pointed out in last years BBBA, "The debate over the various Runs Created [he's using Runs Created as a generic term] methods is revealed as no debate over methods at all. It is a debate over standards. You tell me what standards you want to apply to Runs Created methods, and my computer can tell you which method best meets them."
Although Brock decided to adopt Bill James' standard, I made a different choice. Rather than choosing one or the other, I decided to use both Pete Palmer's accuracy standard and Bill James' accuracy standard. This way, I figured, people could use the standard they're most comfortable with.
(I won't go into the details here since I realize that some people will get bogged down by the math. Instead, I suggest that anyone interested read Methods and Accuracy in Run Estimation Tools.)
Anyway, what I found in my examination was that the linear formulas were comparable in accuracy to James' RC. Some years RC was better; some years ERP was better; and some years BR was better. Upon closer inspection, I theorized that the slight difference in accuracy between RC, ERP and BR could be the result of a few things 1) the nature of the formulas, 2) the data sets and, 3) the time periods involved in the development and evaluation of the formulas. To check to see if these ideas could be correct, I decided to try and improve on Johnson's ERP by experimenting with different data sets and seasons.
Deciding on the data
The next step in the process was to decide which statistics to include in the formula. Since my initial accuracy study determined that the most accurate statistics were James' RC, Palmer's BR, and Johnson's ERP, I decided to mix and match from the various data sets. To save you some time, here's a comparison of their data sets:
RC - H, TB, BB, IBB, HP, AB, GIDP, SB, CS, SH
BR - 1B, 2B, 3B, HR, HP, BB, AB, SB, CS, OOB
ERP - H, TB, BB, HP, AB, SB, CS, GIDP
I also decided to experiment with strikeouts because I remembered that Bill James had estimated in his 1992 Bill James Baseball Book (pg.37) that for every additional 100 strikeouts a team would lose about 1 run.
Runs through regression
Using regression analysis, I determined which statistical ingredients should get throw into my run estimation pot. After literally running hundreds of regressions, and after comparing some of my own regressed numbers with those generated by others (again, see the "Runs through Regression Analysis" section of the “Why Do We Need Another Player Evaluation Method?” essay), I generated some ball park numbers to start with.
Comparison to other models
I then spent some time comparing the regressed numbers to the values other people came up with using other techniques. Many analysts have generated run values of the various events using different techniques. George Lindsey, Steve Mann and Paul Johnson produced their numbers by examining play-by-play data. Pete Palmer generated his numbers with a simulation-based study. Others estimated values by building probability tables.
Since my goal was to generate numbers that would be mathematically accurate AND would be theoretically relevant, this part of the process was very important. I took a long, hard look at all this data to ensure that my numbers made sense.
Peer review
At this point of the process, I decided to get some input from other knowledgeable baseball analysts. I posted my preliminary figures on the rec.sport.baseball newgroup. I also contacted anyone who I thought could help in the process.
Luckily, I know some very knowledgeable baseball analysts. David Grabiner, Tom Ruane, John Jarvis, Alan Shank, Alidad Tash, Dan Szymborski, Greg Spira, James Tuttle, Arne Olson, and BBBA's own Don Malcolm and G. Jay Walker. All contributed something interesting or useful to the process. In particular, David, Tom, John, Jay and Don, each took a bunch of time from their busy schedules to give me some very valuable input. I greatly appreciate their help.
Empirical analysis
As I said above, to ensure that the final numbers would be both accurate AND make sense, it was important that I properly balance theoretical and mathematical considerations to generate the final values of each event.
This required quite the juggling act. In particular, generating coefficients that would work during both relatively low scoring periods (1963-1968) and relatively high scoring periods (1994-1997) proved difficult. To get it right, I had to spend a great deal of time massaging the data.
Luckily through hard work, I was able to come up with numbers that accomplished this task.
What did I finally come up with? Read on.
Extrapolated Runs Unveiled
Extrapolated Runs was developed for use with seasons from 1955 to the present. I came up with three versions of the formula. The three formulas are:
- XR - Extrapolated Runs
= (.50 x 1B) + (.72 x 2B) + (1.04 x 3B) + (1.44 x HR) + (.34 x (HP+TBB-IBB)) +(.25 x IBB)+ (.18 x SB) + (-.32 x CS) + (-.090 x (AB - H - K)) + (-.098 x K)+ (-.37 x GIDP) + (.37 x SF) + (.04 x SH)
- XRR - Extrapolated Runs Reduced
= (.50 x 1B) + (.72 x 2B) + (1.04 x 3B) + (1.44 x HR) + (.33 x (HP+TBB)) + (.18 x SB) + (-.32 x CS) + ((-.098 x (AB - H))
- XRB Extrapolated Runs Basic
= (.50 x 1B) + (.72 x 2B) + (1.04 x 3B) + (1.44 x HR) + (.34 x (TBB)) + (.18 x SB) + (-.32 x CS) + (-.096 x (AB - H))
As you can see, calculating XR requires only addition and multiplication. Its simplicity of design is one of its greatest attributes. Unlike a lot of the other methods, you don't need to know team totals, actual runs, league figures or anything else. You just plug the stats into the formula and you are all set.
Another of XR attributes is that the formula is pretty much context neutral. Other than park effects, the only remaining residue of context is due to the inclusion of IBB, GIDP and SF. Although I could have removed them from the full version, I felt that the inclusion of these terms was important since my research showed there was a strong correlation between the IBB, SF and GIDP opportunities that players face. I also felt, like Bill James, that these statistics do tell us something valuable about players. Of course, I knew some people might not agree with me. For them, I created two other versions.
XR also accounts for just about every out. James correctly understands that the more outs an individual player consumes the less valuable his positive contributions are. Since XR will be used as the base of the Extrapolated Win method, I thought it was important to include as many outs as possible in the formula.
Another nice thing about XR is that if you add up all the players' Extrapolated Runs, you'll have the team totals. That's a benefit of using a linear equation.
You may now be wondering how well these stats compare to other statistics in accuracy? Well although I go into more detail in the Methods and Accuracy in Run Estimation Tools article, I do want to give you some idea about how these three methods compare to each other and, of course, to a few of the other methods.
A player example
To illustrate how to calculate a player's XR, I'll use Mark McGwire's 1998 statistics.
XR=(.50 x 61) + (.72 x 21) + (1.04 x 0) + (1.44 x 70) + (.34 x (6+162-28)) +(.25 x 28)+ (.18 x 1) + (-.32 x 0) + ((-.090 x (509 - 152 - 155)) + (-.098 x 155)+ (-.37 x 8) + (.37 x 4) + (.04 x 0)=166.35
If I had used the other versions of XR, I'd generate slightly different numbers. For example: XRR=167.05 and XRB=169.03. The differences stem from the excluded of data. In McGwire's case, the discrepancy stems from this SF/GIDP difference and the large number of walks he had in 1998.
For the time period of 1984-1998, I found that players' values differ, on average, by about 0.7 runs. Of course, some players' values change much more. Players with extremely high totals of GIDP, HP, SO, BB can have their values change quite a bit. For XRR, Howard Johnson gained the most runs (+6, in 1991) due to the great disparity between his 15 SF and his 4 GIDP. At the other extreme, Jim Rice lost the most runs (-8, 1984) mainly due to 36 GIDP and only 6 SF.
A league example
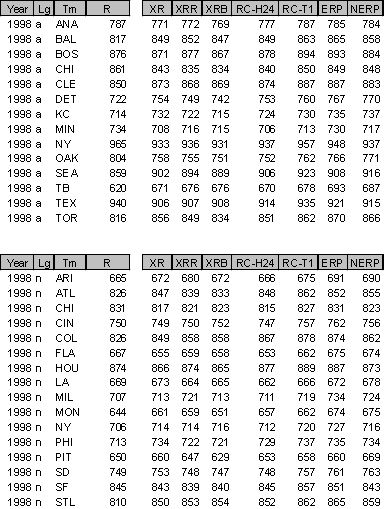
To give you an idea how XR works on a team level, here's some numbers from the 1998 season. Since both XR and James' new RC were designed before the 1998 season data became available, this is the first comparison where the methods are flying solo.

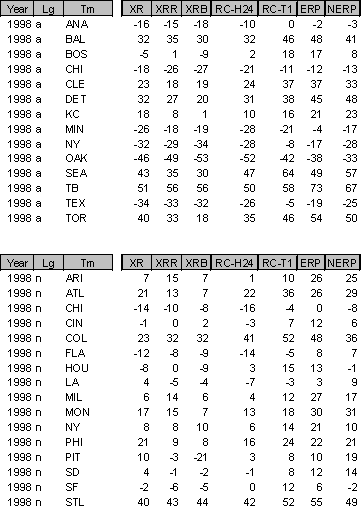
To make the comparison easier, here's a table with error data broken down.

One interesting thing you should notice is how, generally speaking, all the methods make similar errors. For example, if one method is off by about +30 runs, the other methods are all pretty close to the +30 figure. That leads me to believe that typical error is due to either things which the method doesn't take into account and/or are the result a non-standard distribution of events. These are things that mostly cancel out, but as you can see they don't even out completely.
Comparing accuracy
This is the point where there is disagreement. Bill James uses standard deviation and average absolute errors to score methods. Pete Palmer uses regression equations to determine error. None of these methods is inherently superior. They just measure the error in slightly different ways.
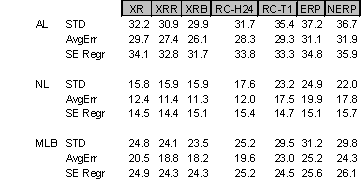
How do the methods compare in 1998? Here's the summary data.

Using standard deviation (STD, root mean square error), XRB comes out on top for the AL and MLB, while XR tops the NL.
Using Average absolute Error (AvgErr, or the sum of the absolute errors), XRB makes a clean sweep.
Using the Standard Error of Regression (SE Regr, or Palmer's choice, which he calls linear curve fitting), XRB tops the AL, XRR tops the NL, and they both tie for the lead for MLB.
One thing I'd like to point out is that 1998 was an off year for all the evaluation methods. Every evaluation method scored worse than it normally does. Since XRB, is less accurate over the 1955-1997 time period, the fact that it comes out on top this year is very suspect. I consider its win this year as a fluke.
Another factor to keep in mind is that these values are generated from team totals. As Jay and I showed in our "Deciphering the New Runs Created" article, the summed individual player totals for RC does not equal the team total. This means that the RC totals presented here are for RC on the team level only. It also means that RC is slightly more inaccurate than these numbers imply.
To get a better idea of how these measure compare, read the essay A Question of Accuracy.
Top Players in 1998
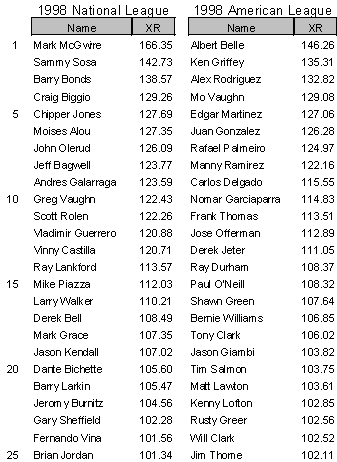
Who were the top players in 1998? Here's their ranking by XR:

It should come as no surprise that Mark McGwire generated the most runs of any player. However, having said that, I like you to keep one thought in mind. These runs are only a tip of the iceberg. XR only measures the DIRECT runs that a player produces.
Since baseball is a team game, a player's ability to avoid making outs affects other players. That means that besides the runs a player produces while he is at the plate, he is also partially responsible for the runs his teammates produce later on in the game. I won't go into any more detail about it here. I just mention this because although XR doesn't deal with this part of the run scoring process, the Extrapolated Win method does. To find out more, you'll have to read on.
Some closing thoughts
Like I said previously in this article, I had a lot of help putting XR together. So, I'd like to once again pass on my appreciation to everyone who assisted me in the process. In particular, I'd like to thank my wife, Donna, and my kids, Ryan and Karlin, for putting up with my absence during the many, many hours I was either buried in the books or glued to the keyboard. Without their patience, I could not have produced such a useful sabermetric tool.
I'd also like to thank you for taking the time to read this. During the article, I hope I convinced you of the validity of at least one of my opinions. If XR perfectly suits your needs, great! If not, I hope you'll still find it useful. In the event neither of these things is true, I hope I've at least convinced you that I've been blessed with one great family and some really helpful friends.
Back to the top of page | BTF Homepage | BBBA Web Site