|
|
 |
Methods and Accuracy in Run Estimation Toolsby Jim Furtado |
[ Webmaster's Note: The following article appears in The 1999 Big Bad Baseball Annual. ]
Measuring Accuracy
How do all the offensive statistics measure up in an accuracy comparison? To answer that question, I put together a study to examine how well each statistic relates to run scoring. Unfortunately, setting up the study wasn't a straightforward proposition. That's because there isn't a general agreement among sabermetricians about how accuracy is best calculated.
As a matter of fact, the two greatest minds in sabermetrics disagree about this. Bill James uses standard deviation (really Root Mean Square Error or RMSE) and absolute errors to compare accuracy. Pete Palmer uses regression equations to answer the question.
How did I decide to answer the question? Rather than restrict my study to either Mr. James' or Mr. Palmer's accuracy standard, I decided to study the matter employing both of their standards. By doing so, I figured, anyone looking it over could chose whichever standard they prefer.
Because this is a baseball book and not a math book, I won't take up a bunch of time explaining the entire process in detail. If you don't already have an understanding of standard deviations, regression equations, correlation and the like, I regret to tell you that you won't find an explanation of them here.
The reasons are simple. First, there aren't an infinite number of pages that this book can hold. If I had to explain every math term and concept here, it would have to be at the expense of other material. Other material that is a heck of a lot more interesting to read than mathematical techniques.
Second, I'm not properly qualified to teach them to you. I'm a baseball analyst, not a math professor. Rather than trying to learn it from me, you'd be better off taking a good introductory college statistics class. Of course, you might not have the time or desire to do that. If that's true, but you'd still like to get a basic understanding of the methodology, I suggest you pick-up a copy of Baseball by the NUMBERS: How Statistics Are Collected, What They Mean, and How They Reveal the Game by Willie Runquist. In this book the author examines many baseball statistics with a focus on the underlying mathematics. Even though reading it won't replace a good stats class, if you are comfortable with math, it will help you understand the methods used in this essay.
How did I generate run totals for the different stats?
As I said in the “Why Do We Need Another Player Evaluation Method” essay, rate statistics need an additional step to express the measure in runs. How did I do this? I divided the team measure by the league average and then multiplied the result by the league runs per out and by the number of team outs (which I calculated as AB-H=SH+SF+CS+GIDP).
Here's an example using batting average and the 1955 Boston Red Sox. In 1955, the Red Sox hit .264 that season and consumed 4145 outs. The league averaged a .258 batting average and scored .170 runs per out. To generate the Red Sox run total, I put all the numbers together: .264/.258 x .170 x 4145=721.037 Runs. Using this method, I produced run estimates for every stat included in the study. This was done for every team from 1955-1997 (1002 team seasons).
For the statistics that are already expressed in runs, things were much simpler to calculate. I directly compared estimated runs with actual runs.
What numbers did I calculate?
I calculated figures that correspond to the methodologies used by Bill James and Pete Palmer.
Bill James Methodology
I applied the standard that Bill James used in his Baseball Abstracts.
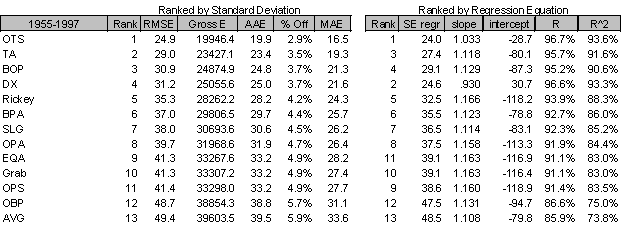
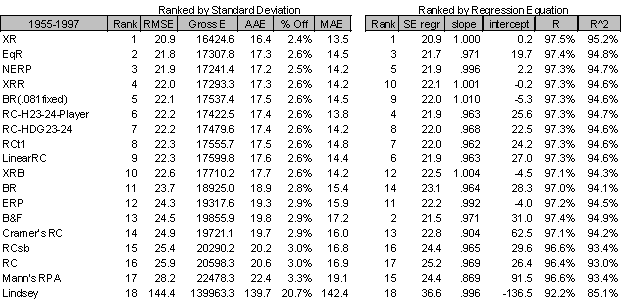
RSME - Root Mean Square Error or Standard Deviation between projected and actual runs
Gross E - Gross Error or the sum of absolute difference between the projected and actual runs
AAE - Average Absolute Error - the average of the absolute difference between the projected and actual runs
% Off - Gross E divided by the sum of actual runs
MAE - Median Absolute Error or the error located at the halfway point of all errors
Pete Palmer Methodology
In The Hidden Game of Baseball, Pete Palmer ranked a few stats using what he called "linear curve fitting". Linear curve fitting, in this context, is nothing other than the use of a regression equation to measure the linear relationship between estimated runs and actual runs.
SE regr - Standard Error of the Regression using the standard formula y=mx+b where y=actual runs, m=slope of the regression line, x=estimated runs, and b=intercept point of the regression line
R - correlation coefficient or how closely the estimated runs and actual runs conform to a linear relationship (If there is a perfect correlation between the two, this number would equal 1.)
R^2- Coefficient of determination or the proportion of the variation in runs that can be explained by relating actual runs to estimated runs
What are the numbers?
Rate Stat Scorecard

Run Stat Scorecard

Although most of the statistics' abbreviations are defined elsewhere, a few aren't. Included are a couple of RC spin-offs: LinearRC is the linear component of the new RC calculation that I explained in “Deciphering the New Runs Created” essay. RC-H23-24-Player is the number of runs that the player context formula generates if team stats are placed into the formula. BR(.081fixed) is Palmer's BR using a set value (-.081) for outs for the entire period. Grab is David Grabiner's suggested modification to OPS (1.2*OB+SLG).
What should you make of these numbers?
I'd prefer that you draw your own conclusions, but since I realize that you may want my opinion, here's a few things to keep in mind. (Feel free to stop reading here, if my opinion doesn't really interest you. :)
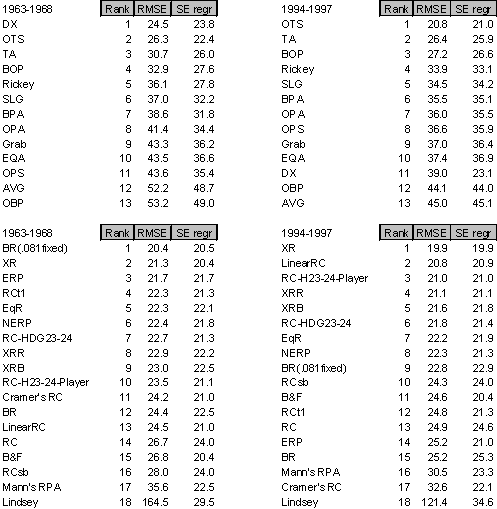
- XR was developed with the same data used in the validation study. This means XR gets something of a helping hand. Because of that I also supply a few other comparisons. The first is a decade-by-decade comparison (with only RMSE and SE regr). The numbers indicate that XR holds its accuracy advantage across different periods.
Decade Match-up

- On the team level, there really isn't that much of a difference between most of the run estimation methods. Although XR comes out on top, the gap isn't earth shattering. Of course, as Jay and I pointed out in the “Deciphering the New Runs Created” essay, the numbers generated on the team level don't necessarily equal the numbers used for player comparisons. This means that for most methods, the accuracy on the player level is different than the accuracy on the team level. This is true even for Palmer's Batting Runs. Since BR contains a term for Outs On Base for team calculations, but excludes the term for player calculations, accuracy for individual players is worse than this study indicates.
- EQA's accuracy lies in the eyes of the beholder. If you figure things out the way Clay Davenport tells you to, it ranks at the top of the rankings; if you don't, it doesn't. As a matter of fact, if you compare EQA to Grab, you won't find much difference. This indicates to me that EQA isn't really much different than OPS.
- OPS doesn't possess the accuracy that Pete Palmer's study implies. David
Grabiner pointed out a possible explanation. David explained that the reason
OPS is considered to have better accuracy than my study shows is that Palmer's
OPS accuracy claims are based on OPS's correlation with OTS. What this means is
that if OPS had a perfect linear relationship with OTS, the accuracy of OPS
would be the same as the accuracy of OTS. I investigated this and found OPS's
correlation with OTS was indeed very high (.998556). I then took a look at
David's suggested modification 1.2*OBP+SLG (GRAB). GRAB had a correlation
coefficient (R) figure of .999173. Although this correlation figure is pretty
high, it's still not a perfect correlation. To generate a better correlation
figure, a much more involved formula is required. David sent me a formula [
OTS=.333*.400 + (OBP-.333)*.400 + .333*(SLG-.400) + (OBP-.333)*(SLG-.400)
-.333*.400 + (1.2*OBP+SLG)/3 + (OBP-.333)*(SLG-.400) ] which produces an almost
perfect correlation figure (1.00000000).
You might be thinking, "OK, what does this really mean?" Well, what it means is that although OPS is a very good quick and dirty method, it's not as accurate as some of its proponents claim. So if you want to get a good quick estimate, OPS works fine; if you want a more accurate assessment, you're better off using one of the other methods. - My study shows that with the proper selection of event values, a linear formula is more accurate for the different run scoring periods.
Linear vs. non-Linear Match-up

- Although the other formulas move around in ranking, XR stays near the top for both run scoring environments. This finding directly contradicts James' assertion in the Historical Baseball Abstract that linear formulas cannot accurately estimate runs because "run scoring is not linear." Although I agree with Mr. James that run scoring is not linear, I don't believe that this fact prevents the use of a non-linear formula to estimate runs created. That's because as long as the frequency and distribution of events is pretty stable (and it has been) run scoring can be looked at as linearthe more positive events that a team packs into a game, the more runs it scores. My numbers confirm this assertion.
- XR is designed for use from 1955 onward. Although you can use the formula for seasons prior to 1955, I haven't confirmed its validity for that period. Having said that, I've already begun work on creating other versions for seasons prior to 1955.
Closing thoughts
As I mentioned at the top of the article, I'm a baseball analyst, not a math professor. With that in mind, I'd like to encourage any and all input from all the math experts reading this article. Although I'm confident that I've got a good handle on the topic, I'm open to other ideas about how to examine the accuracy question.
Also, if any of you math experts have written (or can write) something that explains all the underlying math in a simple, easy to understand manner, and if you're willing to share your knowledge, please contact me. I'd really like to include a nice explanation in future versions of this article.
Speaking of the web, I encourage everyone with Internet access to check out the web version of this article. Since my web site does not suffer from the space constraints that the printed word does, I'm free to include more, more, more data. You can find the webified version at http://www.baseballstuff.com/btf/scholars/furtado/accuracy.htm.
[ Webmaster's Note: Updated information will soon be available. ]
In closing, I suggest that anyone interested in other looks at the same question, read John Jarvis' "A Survey of Baseball Player Performance Evaluation Measures" and Alidad Tash's "Win and Run Prediction in Major League Baseball".
Back to the top of page | BTF Homepage | BBBA Web Site