
|
|
The 'Brain' of the game unveils formula that statistically disproves cherished myths and demonstrates what really wins
by Branch Rickey
As the man who guided the St. Louis Cardinals to six National League pennants and the Brooklyn Dodgers to two. Branch Rickey, currently general manager of the Pittsburgh Pirates, is considered baseball's brainiest and most successful executive. He was among the first to use such revolutionary practices as the farm system and the mass tryout camp, the first executive to see the value of using baseball statistics in putting together and running his teams. Now he has developed another approach to the game which LIFE here presents.
Baseball people generally are allergic to new ideas. We are slow to change. For 51 years I have judged basebal by personal observation, by considered opinion and by accepted statistical methods. But recently I have come upon a device for measuring baseballl which has compelled me to put different values on some of my oldest and most cherished theories. It reveals some new and startling truths about the nature of the game. It is a means of gauging with a high degree of accuracy important factors which contribute to winning and losing baseball games. It is most disconcerting and at the same time the most constructive thing to come into baseball in my memory.
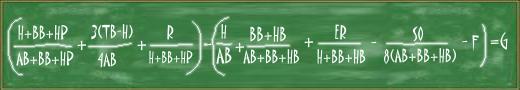
The formula, for I so designate it, is what mathematicians call a simple, additive equation:
![]()
![]()
The symbols, familiar to all baseball fans, are explained in the caption to the picture above. The part of the equation in the first parenthesis stands for a baseball team's offense. The part in the second parenthesis represents defense. The difference between the two—G, for the game or games—represents a team's efficiency.
Can this bizarre mathematical device be put to any practical use? It can indeed! It can be applied to any manor league club for any season or part of a season to diagnose points of weakness and strength. For example, the formula tells a strange story when applied to this year's National League pennant race. Why are the New York Giants, who trailed by 35 games last year, leading with the season more than half over?
The formula reveals that the Giants' offense until the last few weeks was not appreciably stronger than in 1953. If anything it was a shade weaker. Even with Willie Mays in the lineup the Giants were getting a few less men on base than last year, their power hitting was off a shade. These two factors were offset by a slight rise in ability to get base runners home with runs. But the formula establishes that the real reason for the Giants' spectacular success this season has been pitching an the key to pitching success is the staff's ability to keep men who get on base from scoring.
The formula is designed principally to gauge and analyze performance on a team basis. But certain elements in it provide a yardstick for measuring individual talent. It can show a manager how and why certain players are helping the team and how and why others are failing. A complete understanding of the formula could influence player trades. It can cause an intelligent manager to alter some features of his tactical approach to the game.
If the baseball world is to accept this new system of analyzing the game—and eventually it will—it must first give up preconceived ideas. I had to. The formula outrages certain standard that experienced baseball people have sworn by all their lives. Runs batted in? A misleading figure. Strikeouts? I always rated them highly as a determining force in pitching. I do now. But new facts convince me that I have overrated their importance in so far as game importance is concerned. Even batting average must be reexamined.
What Johnny Whosit hit
There are people who pride themselves on their ability to quote what Johnny Whosit hit the year of the big flood. Among fans it is the accepted standard of excellence at bat. Why? Principally because it is easy to figure. Even the professionals lean upon it. But batting average is only a partial means of determining a man's effectiveness on offense. It neglects a major factor, the base on balls, which is reflected only negatively in the batting average (by not counting it as a time at bat). Actually walks are extremely important. Ted Williams, a student of batting values, bragged more about the 162 gases on balls he got five years ago than about his .343 batting average or his 43 home runs.
Statistics, of course, cannot tell the whole story. They fall short of bridging the gap between human expectancy and fulfillment. They cannot measure such intangibles as intelligence, courage, disposition, effort.
But somehow baseball's intangibles balance out. They reflect themselves in other ways. Over an entire season, or many seasons, individuals and teams build an accumulation of mathematical constants. A man can work with them. He can measure results and establish values. He can then construct a formula which expresses something tangible, and that is why this formula was devised.
It was a slow and tedious task. When LIFE first asked me six months ago if the development of such a formula was possible, I expressed serious doubts. In the past little effort and almost no thought has been spent on separating the basic elements of baseball and giving them a relative value. Mr. Connie Mack was once quoted as saying that pitching was 70% of the game. My own feeling, before compiling and examining any evidence, was that pitching was at least 50% of the game. I considered it baseball's most important single department. Give me four superb starting pitchers—Christy Mathewson, Cy Young, Walter Johnson and Dizzy Dean—and I felt I could win a pennant with Humpty Dumpty at every other position. George Weiss, general manager of the New York Yankees and a man whose opinion I respect, put pitching at about 35% of the game.
What were the facts? To help assemble data that would lead to facts I brought in Allan Roth, who prepares and refines statistics for the Brooklyn Dodgers and who, in my opinion, is the top statistical specialist in baseball.
The problem had to be approached cautiously. It became apparent after several false and frustrating starts that baseball statistics were indeed puzzling. They tried men's patience. Only after reverting to bare ABCs was any progress noted. We knew, of course, that all baseball was divided into two parts—offense and defense. We concluded further that weakness or strength in either of these departments could be measured in terms of runs. Thus offense was equal to the number of runs scored by a team and defense was equal to the number of runs scored against it. It was the only practical way to figure it. These were the facts.
The next step was to find out how to use them. Perhaps, by taking the runs scored per game by major league clubs over an entire season and measuring them against opponents' runs, some pattern could be determined. We compiled these figures for both major leagues for each season over the past 20 years. We got other statistics and combinations of statistics. The pile became bulky and finally overwhelming. It was obvious that it needed processing by mathematical experts.
We took the figures to mathematicians at a famous research institute. Did they know baseball? No, but that was not essential.
Their job was to take our figures and our guidance and, by the process of correlation analysis, see what relation one set of figures had to another. Was the pennant winner the club with the best pitchers or greatest batters or surest fielders? Did the finish of a season's race reflect accurately the total number of hits or runs made by a club?
After six weeks the findings came back. Among them was one which constituted a framework around which to build a formula. The mathematicians discovered that by subtracting opponents' runs from the runs scored per game by a team over a season they got a column of figures which correlated strongly with the final standings. In the National League last year, for example, it related to the order of finish as follows:
| CLUB | O (CLUB'S RUNS PER GAME) |
D (OPPONENTS' RUNS PER GAME) |
O MINUS D |
GAMES BEHIND LEAGUE LEADER |
| Brooklyn | 6.16 | 4.45 | 1.71 | 0 |
| Milwaukee | 4.70 | 3.75 | .95 | 13 |
| St. Louis | 4.89 | 4.54 | .35 | 22 |
| Philadelphia |
4.59 |
4.27 |
.32 |
22 |
| New York |
4.95 |
4.82 |
.13 |
35 |
| Cincinnati |
4.61 |
5.08 |
-.47 |
37 |
| Chicago |
4.08 |
5.39 |
-1.31 | 40 |
| Pittsburgh |
4.04 |
5.76 |
-1.72 | 55 |
In other words offense (which we shall refer to as O) minus defense (which we shall refer to as D) indicates the number of games a team was behind the leader. The equation: O-D=G—the condensed version of the big formula shown at the beginning of this article. It proved 96.2% accurate when applied to final major league standings over the last 20 years.
This, of course, was just the beginning. By using O-D=G as a guide, it was possible to jump off into unexplored territory, testing the footing to learn where we were on solid ground and where we sank in. If we could separate the measurable component parts of offense and relate them one to another, we would have half of the formula. If we could do the same thing with defense we would have all of it.
What were the factors that went into the scoring of runs? There were a barrel of them. There was ability to get on base by any means possible. There was power, the ability to hit for extra bases rather than just singles. Then there was speed, daring on the base paths, timeliness of hitting and making the most of opportunities.
Of course, there were the unmeasurable factors. In my experience probably the most important single thing in batting has been the mental attitude of the hitter going to the plate. The most gripping moment in any field of sports comes when batter faces pitcher. Batter and pitcher eye each other. Psychologically one or the other is in command before a ball is thrown. But can you measure this? Could you measure the arrogance of a Rogers Hornsby as he got ready to take his cut. Walter Johnson's utter indifference to the identity of any batsman who ever faced him?
Eyesight is another variable factor. Babe Ruth's eyes were so quick, it is said, that he could read the label of a phonograph record while it was spinning. I suppose there is a way to get an optometrist's rating on hitters' eyes, but that could not help fix a formula.
But the ability to get on base, or On Base Average, is both vital and measurable. It is determined by this:
![]()
(We have added BB and HP to the bottom part of the fraction because they are not included in official times at bat in present baseball statistics.) For example, Stan Musial's OBA for last years was
![]()
This means that he got on base 43.7% of the times he faced the pitcher. This is a far more significant figure than just batting average alone, which was
![]()
The virtue of this approach is that it gives a positive evaluation to walks. A few years ago Virgil Stallcup walked only six times in an entire season or once every 72 trips to the plate. Compare this to Eddie Stanky who set a league record with 148 bases on balls in one season, or once every 4 ¾ appearances. Although we did not try to evaluate the base on balls statistically, I would rate it about 75% of a base hit—because a base on balls can never advance a runner more than one base and cannot advance him at all unless there is a runner on first.
The next measurable quantity is Extra Base Power. There are several ways of computing this. The conventional slugging average which most baseball people use is simply total bases over times at bat. My own formula for computing power, which I have used for years, and called "isolated power," is the number of extra bases over and above singles in relation to total number of hits. It turns out that neither of these is as reliable in determining extra base power as a formula which combines the two. This new power quotient, determined by
![]()
is the percentage of extra bases per times at bat. For Stan Musial last year it came out
![]()
It compares with a National League or .145 and cannot be excluded from any formula for offense.
Now that we have men on base how do we get a formula for getting them home? It must include speed, taking the extra base, stealing one occasionally, managerial savvy and timeliness of hitting. All these capabilities, unmeasurable in an individual, are reflected by one statistic which has never been used to my knowledge and which I shall call "clutch." It is simply the percentage of men who got on base who scored.
It is determined by dividing actual runs by the number of opportunities to score, or base runners.* The method for determining this is
![]()
It shows that Brooklyn was by far the best in the big leagues in this department last year with
![]()
or 43% of its base runners scoring. It is a clear reflection of the club's general efficiency. By comparison the inept St. Louis Browns scored with only 30% of its base runners.
These were the three basic, measurable ingredients for offense: on base average, extra base power and clutch. But how did they fit together? Were they all equal in importance? To find out in what proportions they did add up to runs scored we measured them against major league records for the last 20 years, seeing how one related to the other in actual offensive results. The correlation showed that OBA went hand in glove with runs scored. When one was high for a team, so was the other. Clutch was just as strong, but extra base power had a lower correlation. In relating each of these ingredients to each other in the indicated proportions we had to give extra base power less importance. So offense became
![]()
Was this the formula for offense? It was easy to find out. We went back over the record of every major league club of 20 years substituting figures from the official averages for symbols and working out totals. These totals correlated with runs per game for each club almost perfectly. The margin of error was 2%. There had been some arbitrary decisions and values adopted in putting the formula together, but checking back proved that the assumptions had been correct. Since runs scored are the final expression of offensive strength, it looked as if we had our offensive formula.
Unfortunately there was no way of applying all three of these basic factors to individuals as well as teams. Clutch was strictly a team figure, but after giving it a thorough trial we found there was still no place for RBIs in the formula. As a statistic, RBIs were not only misleading but dishonest. They depended on managerial control, a hitter's position in the batting order, park dimensions and the success of his teammates in getting on base ahead of him. That left two measurable factors—on base average and power—by which to gauge the over-all offensive worth of an individual. We applied them to some of the game's greatest hitters and arrived at a rating for each.
How the greatest hitters are rated
Who came out as the greatest of all time? There could be only one. Babe Ruth came out head and shoulders over his closest rival. If he had not I would say without hesitation that we were on a cold trail with our formula. The ratings on the opposite page are based on composite records since 1920, the year the lively ball came into use.
I know that the order in which these hitters are rated is apt to shock some students of batting. I was shocked myself. I found it difficult to believe that only one American Leaguer among the first 25, Ted Williams, was still active. I found it equally difficult to believe that the National League still has four going strong Kiner, Campanella, Musial and Robinson. Admittedly there were discrepancies in the ratings, partly due to park dimensions.
The list shows some great batters high in OBA and low in power. It is unfair to great performers like Tris Speaker and Ty Cobb, and it does not even include George Sisler, one of baseball's best batsmen, since some of their best years came before 1920 in the era of the dead ball. Cobb deserves to be higher because he beat you with more than his bat. He stole more bases per season than an entire team does today—and stolen bases are not included in the above table. He beat you with brains, aggressiveness and
|
GREATEST HITTERS SINCE 1920 |
||||
|
BATTER |
ON BASE AVERAGE |
EXTRA BASE POWER |
BATTING RATING |
|
| 1 | Babe Ruth |
.481 |
.271 |
.752 |
| 2 | Ted Williams |
.484 |
.218 |
.702 |
| 3 | Lou Gehrig |
.447 |
.219 |
.666 |
| 4 | Jimmy Foxx |
.429 |
.213 |
.642 |
| 5 | Rogers Hornsby |
.449 |
.185 |
.634 |
| 6 | Hank Greenberg |
.412 |
.219 |
.631 |
| 7 | Ralph Kiner |
.404 |
.212 |
.616 |
| 8 | Stan Musial |
.432 |
.177 |
.609 |
| 9 | Joe DiMaggio |
.398 |
.191 |
.589 |
| 10 | Mel Ott |
.414 |
.172 |
.586 |
| 11 | Charlie Keller |
.410 |
.174 |
.584 |
| 12 | John Mize |
.397 |
.187 |
.584 |
| 13 | Harry Heilmann |
.431 |
.184 |
.579 |
| 14 | Tris Speaker |
.441 |
.135 |
.576 |
| 15 | Hack Wilson |
.395 |
.178 |
.573 |
| 16 | Ken Williams |
.400 |
.168 |
.568 |
| 17 | Earl Averill |
.395 |
.162 |
.557 |
| 18 | Roy Campanella |
.375 |
.178 |
.553 |
| 19 | Lefty O'Doul |
.413 |
.139 |
.552 |
| 20 | Bob Johnson |
.393 |
.157 |
.550 |
| 21 | Chuck Klein |
.379 |
.167 |
.546 |
| 22 | Dolph Camilli |
.382 |
.161 |
.543 |
| 23 | Ty Cobb |
.382 |
.161 |
.542 |
| 24 | Jackie Robinson |
.414 |
.125 |
.539 |
| 25 | Tommy Heinrich |
.382 |
.157 |
.539 |
[BTF Editor's Note:
Cyril Morong notes, "In the "GOODBY TO SOME OLD BASEBALL IDEAS" by Branch Rickey, the on-base average and isolated power given for Ty Cobb are incorrect. Instead of .382 and .161, respectively, they should be .431 and .148, respectively, for the years 1920-28. The error might have occurred because the .382 and .161 are the same as Dolph Camilli, who is just above Cobb in the rankings."
My copy of the original article is buried in a box somewhere in my basement due to a recent move. Since I haven't verified Cyril's numbers and since I'm not sure whether the error was made in the original article or during the conversion process, I've decided to make a note here rather than make a change to the article.--Jim Furtado]
opportunities, all the things that show up in clutch which we cannot estimate for an individual player. When Cobb got on base his very presence there upset the pitcher. It caused the infield to make errors it would not otherwise make. Jackie Robinson of Brooklyn has the same nuisance value to a lesser degree today, and as a runner on third he has no equal.
Now that we had the formula for offense under control, what about defense? There were two factors involved, pitching and fielding, and only one of them—pitching—was measurable on either a team or individual basis. There is nothing on earth anybody can do with fielding.
Fielding averages? Utterly worthless as a yardstick. They are not only misleading, but deceiving. Take Zeke Bonura, the old White Sox first baseman, generally regarded as a poor fielder. The fielding averages showed that he led American League in fielding for three years. Why? Zeke had "good hands"! Anything he reached, he held. Result: an absence of errors. But he was also slow moving and did not cover much territory. Balls that a quicker man may have fielded went for base hits, but the fielding averages do not reflect this.
Fielding then cannot be measured, although it must be admitted that, all other things being equal, it could be the difference between winning and losing four or five games or mean the run that wins the big game. But application of the formula to 20 years of statistics shows fielding to be worth only about one half as much as pitching or 15%. No team would have an aggregate fielding efficiency of 1.000. So the variation within the 15% between the best fielding team and the worst would be only a few percentage points and does not destroy the general validity of the formula.
But pitching! There's something a man can get his teeth into. If there is any one phase of the game on which I might consider myself an expert it is pitching. Poise, control and stuff are three important assets possessed by great pitchers. And what about his skills? What can he make a baseball do? Does one count for more than another?
Walter Johnson and Preacher Roe
There have been pitchers who have gotten by without one or the other of these basic requirements, but they would have been exceptions in any league and they are not the best. I doubt if Walter Johnson ever gave a thought to pitching to spots, the stock in trade of current pitchers. He just wound up and fired. If you have a strong back and a buggy-whip arm you don't have to think. Preacher Roe, Brooklyn's oldest and most artful pitcher of recent years, is the other extreme. Roe doesn't have much speed, but he has variety. He has control and poise. He sets batters up to swing at a certain pitch. He keeps them off balance and guessing.
Whatever combination of these three qualities a pitcher has, the total is reflected by one standard—Earned Run Average. This is the number of runs, exclusive of those made because of errors, that are chargeable to a pitcher. There have been attempts to substitute for ERA, but none of them has been convincing or successful. We add nothing new to ERA in our formula. But we do learn a good deal by breaking it down. The illuminating chart on the opposite page, which compares lifetime records of eight great ERA pitchers in baseball today, is an example. It presents a comprehensive picture of pitching equipment divided into specific categories.
Some features of these figures gave me a great surprise. They showed me that the difference between a great pitcher and a run-of-the-mill thrower is astoundingly slight. The great ones allow only two less men to reach first base per nine innings. More surprising still, I found that the ability to strike batters out was not a determinant of good pitching in the real sense. As you can see, Eddie Lopat fell below average in this department and Robin Roberts was not far above average. The strikeout kings like Bob Feller and Hal Newhouser were not strong in the bases-on-balls column.
It turned out too that strikeouts had an extremely low, correlation figure when measured against earned run average. All right, if strikeouts were not important in the over-all scheme of pitching, what was? The evidence showed that hits allowed and walks given up were strong determinants. So was keeping base runners from scoring. Among the great pitchers, weakness in any of these departments had to be compensated by strength in another. If Mike Garcia put a goodly number of men on base, he compensated by not allowing many to score. If Robin Roberts allowed a larger percentage to score, he compensated with an exceptionally low bases-on-balls record, which kept his men-on-base average down.
The problem was to put these variables together in a pattern which would add up to the final expression of pitching strength as interpreted in earned run average. We finally got one. In effect, it was roughly the reverse of the formula for offense. First, there was percentage of hits allowed or the batting average against a pitcher. It is determined simply by dividing hits by the number of times at bat or
![]()
If all pitchers in the American League had been as effective as Billy Pierce of the Chicago White Sox last season, the batting average of the league would have been a lowly .218, for that was the batting average against him. Pierce's totals were
![]()
To the batting average against a pitcher we add the percentage of men who got on base because of walks and hit batsman, or
![]()
This was a means of measuring control. The great control artists such as Lopat walked only one batter out of every 20 or 25 that faced them last season. Lopat's figure was
![]()
We came then to the clutch figure for pitching, the percentage of base runners scoring earned runs. The method of calculating was
A good figure in this department was the principal reason why Ed Ford of the Yankees had an excellent earned run average last year. He was the most effective clutch pitcher in the American League with
![]()
![]()
He allowed only 22.9% of the men who got on base against him to score. The average in the league was 31%.
It turned out that hits allowed, walks allowed and clutches were of equal importance. But not strikeouts. After examining all the evidence, I was forced to admit, and I did so grudgingly, that strikeouts contributed nothing more to the end result than pop fouls caught by the catcher. On the basis of statistics we valued that strikeouts at one eighth of the other three more vital factors and got a pitching formula which read
![]()
It contains all the measurable components of pitching. The result correlates with ERA to a high degree, the margin of error being little more than 2%. As with ERA the lower the figure, the more effective the pitcher. It worked as well last year as it did five years ago and when applied to the averages, since 1920, of the 12 great pitchers listed on the next page it was just as reliable.
We now have an instrument for determining the value of elements which go into the two basic departments of baseball. We can examine with sharper insight the performance of a team or individual over a given period. This knowledge can be used to detect flaws that would not otherwise be noted, to give a proper balance to baseball forces, to rearrange batting orders intelligently, to pinpoint problems in pitching. Although the formula gives a comprehensive
|
TODAY'S TOP PITCHERS, BASED ON ERA |
||||||
|
PER NINE INNINGS |
||||||
|
PITCHER |
ERA |
HITS ALLOWED |
WALKS AND HIT BATSMAN |
MEN PUT ON BASE |
STRIKEOUTS |
PERCENT OF BASERUNNERS SCORING EARNED RUNS |
| Average Pitcher |
3.89 |
8.99 |
3.85 |
12.84 |
3.77 |
30.3% |
| Warren Spahn |
2.92 |
7.94 |
2.81 |
10.75 |
4.80 |
27.2 |
| Mike Garcia |
2.97 |
7.94 |
3.04 |
11.67 |
4.32 |
25.4 |
| Robin Roberts |
2.99 |
8.40 |
2.18 |
10.58 |
4.30 |
28.2 |
| Sal Maglie |
3.02 |
8.08 |
3.23 |
11.31 |
4.42 |
26.7 |
| Hal Newhouser |
3.07 |
8.07 |
3.81 |
11.88 |
5.41 |
25.8 |
| Eddie Lopat |
3.14 |
8.93 |
2.64 |
11.57 |
3.25 |
27.1 |
| Bob Lemon |
3.15 |
7.77 |
4.31 |
12.09 |
4.18 |
26.1 |
| Bob Feller |
3.23 |
7.64 |
4.38 |
12.02 |
6.29 |
26.9 |
|
GREATEST PITCHERS SINCE 1920 |
||||||
|
PITCHER |
|
|
|
|
PITCHING RATING |
ERA |
| Carl Hubbell |
.251 |
.053 |
.280 |
.014 |
.570 |
2.98 |
| Dizzy Dean |
.253 |
.060 |
.276 |
.018 |
.571 |
3.03 |
| Lefty Grove |
.254 |
.075 |
.267 |
.017 |
.579 |
3.09 |
| Grover Alexander |
.273 |
.038 |
.285 |
.008 |
.588 |
3.09 |
| Dazzy Vance |
.254 |
.076 |
.286 |
.021 |
.595 |
3.22 |
| Dutch Leonard |
.265 |
.060 |
.284 |
.011 |
.598 |
.325 |
| Bucky Walters |
.254 |
.090 |
.274 |
.011 |
.607 |
3.30 |
| Walter Johnson |
.256 |
.080 |
.286 |
.015 |
.607 |
3.33 |
| Lefty Gomez |
.243 |
.105 |
.273 |
.017 |
.604 |
3.34 |
| Paul Derringer |
.272 |
.052 |
.298 |
.012 |
.610 |
3.46 |
| Fred Fitzsimmons |
.272 |
.067 |
.298 |
.008 |
.629 |
3.51 |
| Ted Lyons |
.275 |
.066 |
.301 |
.008 |
.634 |
3.67 |
diagnosis of teams and players, it has limitations. It cannot predict the performance of a team on any given day or in any brief series because players have good and bad days. Nor can it foresee with accuracy the outcome of a pennant race because players do not always live up to past performances. But the formula is a valuable tool for analysis and just think of what it will do in the hot-stove league arguments.
There was one more important step to take. We had formulas for offense and defense, and we knew the difference between them was very close to the order of finish in the league standings. But were offense and defense of equal value in determining the final result? Through the years I have felt , along with the rest of baseball's old guard, that defense was infinitely more important than offense. Once again I was faced by facts and forced to reverse my way of thinking. The figures showed that offense has gradually taken over the game and has become more important in winning pennants than defense. For the last 10 years in both major leagues the ratio of importance for pennant winners was 54% for offense and 46% for defense, with pitching about 30% of the game.
When George Sisler, the great oldtime first baseman and author of Sisler on Baseball, first saw the figures his reaction was one of bewilderment. "I still don't believe it," he said. "But there it is." And there it was, cold and irrefutable. Brooklyn, which ran away with the National League race last season, won with offense. It scored 6.16 runs per game or 1.41 more than average for the league. But on defense, with 4.45 runs per game scored by opponents, it was only .31 better than average. Milwaukee was the standout on defense last season, allowing only 3.75 runs per game, but its offense was too weak to make up the difference.
Year by year the pendulum has swung back and forth between offense and defense. Defense won for the Boston Braves in 1948 and for the Philadelphia Phillies in 1950. In the American League where the New York Yankees have been on top for five straight years, they won with a preponderance of offense three times and with defense the other two. But mathematical calculation shows offense clearly in command over the past decade.
Had it always been thus? Not by any means. In the old days defense was clearly dominant. The evidence simply pointed up how violently the game had changed. I can even name the year the great change commenced. Anyone can. It was 1920, the year the hopped-up ball with the rubber-cushioned center and tighter-wound Australian wool came into use and the year that Babe Ruth slammed 54 home runs after having only hit 29 the year before.
That started it. Ruth revealed that the home run was good box office. Coincidentally the rules of the game were changed. Spitballs and trick deliveries were outlawed to lessen the effectiveness of pitchers. Fences were here and there moved in toward home plate to put them within range of more hitters. The stolen base deteriorated as an effective tactic. Pitchers in order to cope with the increased scoring violated the balk rule and continue to violate it with umpires making almost no effort to enforce it. The pattern of the great change could almost be plotted by the constant shrinkage in stolen bases and the steady upward surge of the homer. At its extremes it was as follows:
|
Year |
Stolen Bases |
Home Run |
|
1911 |
3,394 |
507 |
|
1953 |
668 |
2,076 |
Everybody in baseball was aware that the complexion of the game was shifting. But few of them stopped to ponder how it affected the game's basic metabolism. The change was slower in the National League than in the American. The National League was still a "pitchers' league" until after World War II, with teams still playing for one run, and the records disclose that as recently as the period from 1934 to 1943 defense was still dominant in the National League. It predominated over offense by 60-40. The offense caught up with the defense in the National League and pushed ahead, just as it did in the American League more than a quarter of a century ago.
The formula, applied to the stars in both leagues this season, discloses that baseball's big bats are mostly in the National League. In the recent All Star game in Cleveland the lineup for the National League outweighed that of the American, according to the formula, in both hitting and pitching.
The National League, whose top batter was Brooklyn's Duke Snider, had five men with a combined on base average and power rating of .600. The big five were Snider (.701), Willie Mays (.686), Stan Musial (.677), Gil Hodges (.623) and Ted Kluszewski (.621). The American League had only two—Ted Williams (.733) and Mickey Mantle (.600)—and the average for all American League All Star hitters was .525 compared to the National League's .551. In pitching the National League had the edge .557 to .575.
On cold dope the National League should have won instead of losing. But if these two squads played 154 games the formula says it would have been a different story. One game is too short a test, especially one like the All Star game which is an exhibition and not a blood-letting contest for league supremacy. Even so, this one might have had a different outcome if the umpires had seen Stone balk and had called the balk rule properly on Virgil Trucks. Failure to call a balk when Red Schoendienst tried to steal home in the eighth inning was crucial. Instead of being a run for the National League it was the third out. The Nationals lost, upsetting both the form and the formula, but that detracts not one whit from the formula's potency.
Now that I believe in this formula, I intend to use it as sensibly as I can in building my Pittsburgh club into a pennant contender. What is wrong with the Pirates? The formula opened my eyes to the fact that the Pirates' OBA is almost as high as that of the league-leading New York Giants. We get plenty of men on base. But they stay there! Our clutch figure is pathetically low, only .277 compared to New York's .397.
This could give reason for a change in the batting order, a closer grouping in the batting order of the club's high OBA hitters. We have to get hitters who can raise the clutch figure. Where are they going to come from? We may have them on the farm team in Hollywood or New Orleans or Denver. My purpose is to raise a crop of players and this thing puts a hoe in my hands and my scouts must indeed use their eyes to find more power for clutch.
This study has been a series of surprises for me. I repeat: baseball people—and that includes myself—are slow to change and accept new ideas. I remember that it took years to persuade them to put numbers on uniforms. I know a manager who still believes that iodine is the panacea for sliding burns. It is the hardest thing in the world to get big league baseball to change anything—even spikes on a pair of shoes. But they will accept this new interpretation of baseball statistics eventually. They are bound to.